WATER SAMPLING
Suggested Grades: 5-8
Driving Questions
Grade 5+
- Why is water sampling important?
- What can water sampling tell us about an environment?
- How does knowing about water properties help us?
Learning Intentions
- I can read and record measurements of temperature, salinity, and pH
- I understand why different samples of water have different properties
- I can talk about what the different properties tell us about water, where it came from, what it is suitable for
Materials
- Thermometer (immersible mercury thermometer or electronic if available)
- Hydrometer/Refractometer
- Litmus paper kit (which can be found at pet-supply stores to check the pH of aquaria)
- Bucket or narrow water container to obtain samples for measurement activities (e.g graduated cylinder; with rubber stopper if sub-surface samples are to be collected)
- Glass dropper (for placing water drop on litmus paper)
- Suggested Water Sampling Locations
- Worksheet for recording data on water properties
Curricular Competencies
Science
- Questioning and predicting
- Planning and conducting
- Processing and analyzing data and information
- Evaluating
- Communicating
Math
- Communicating and representing
- Reasoning and analyzing
- Connecting and reflecting
Lesson
- Discuss the differences between river water, estuary water and ocean water.
- With students plan where to collect water to be tested. Help them choose several different locations that include fresh and saltwater (suggested locations in the K’ómoks Estuary and Courtenay River).
- Have students predict the temperature, salinity and pH differences between water collected in the river, in the estuary or ocean. Record predictions on a sheet.
- Collect samples using the narrow water container. (You could split students into groups where each group samples and tests water for a certain location). For a challenge – A tether line and a rubber stopper with a pull string can allow sub-surface samples to be taken by pulling the stopper at the desired depth. You can then take samples at the same location and compare surface water to water at a certain depth.
- Thermometer Activity: Place the thermometer in the container and hold for 5 seconds then read the scale for temperature. Record the value for the sample on the worksheet.
- Compare the readings for the different locations. Are there differences? Why? What does this tell us about where the sample was taken.
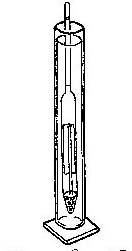
- Hydrometer/Refractometer Activity: Hydrometer- Using the same samples as above in the narrow container, float the hydrometer in the container and read the numbers where the narrow neck of the hydrometer breaks the surface of the water [meniscus]. Record the values for the samples.

- Compare the readings for the different locations. Are there differences? Why? What does this tell us about where the sample was taken.
- The density [specific gravity] of the water determines the buoyancy of the hydrometer. The more salt in the water the more dense it is. Fresh water has a salinity of 0 ppt (parts per thousand) and a density of 1.000. Saltwater has a salinity of 20 to 30 ppt and density of 1.20 to 1.30 depending on temperature and dilution of saltwater with fresh. In an estuary the saltwater from the open ocean is mixed homogeneously with fresh water coming from the land. Higher reading mean more salt.
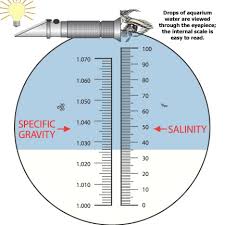
 Refractometer- Open the clear flap and place a small drop of water on the glass underneath. Close flap. Keeping the refractometer level look through the opposite end of the refractometer towards a light source. Part of the field of view will be white and part blue. Take the reading from the right hand side where the two colors meet. The units are parts per thousand.The units are parts per thousand. In the picture to the left the reading is 37 ppt.
- Taking pH Activity – Use the glass dropper to put a few drops of water from a sample onto strips of Litmus paper. Record the pH value for the sample location on the worksheet. Repeat for all samples.
 Compare the readings for the different locations. Are there differences? Why? What does this tell us about where the sample was taken.
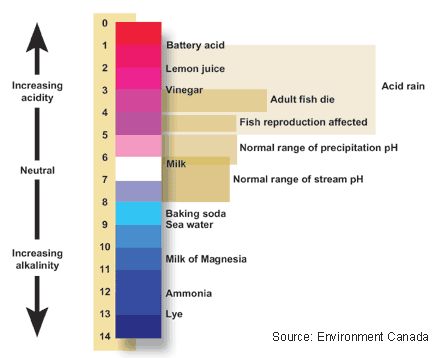
- Litmus paper is simply a strip of paper that, when a sample of water is dropped onto it, turns a certain colour, giving a rough estimate of pH. pH ranges from 0 to 14, with 7 being neutral. pHs less than 7 are acidic while pHs greater than 7 are alkaline (basic). Normal rainfall has a pH of about 5.6—slightly acidic due to carbon dioxide gas from the atmosphere. Acid rain can be very acidic, and it can affect the environment in a negative way.

- Students brainstorm/discuss questions regarding water properties (temperature, salinity, pH) .
- How will the properties change with seasons and sampling location in the estuary? E.g. Higher rainfall in winter more fresh water coming down rivers, high tides bring saltwater further up the river.
- What do these properties mean for plants and animals? Some plants and animals can only live in certain temperature, salinity and pH ranges when these change they have to move, are under stress (don’t grow as well) or die.
- How will these properties change as our climate warms and how does this affect plants and animals? http://wwf.panda.org/about_our_earth/blue_planet/problems/climate_change/
Click here to download a printable version of this lesson
Community Connection
This lessons is often part of a Down by the Bay Field Trip. Project Watershed can supply the materials (thermometers, litmus paper, hydrometers, refractometers) for this lesson.

